Full Stack Example with Docker Compose
This example demonstrates how to bring up a complete Butler SOS stack using Docker Compose. This includes Butler SOS, InfluxDB (v1), and Grafana with a pre-configured dashboard.
InfluxDB Versions
While this example uses InfluxDB v1, there are also Docker Compose files available for InfluxDB v2 and v3 in the same directory:
docker-compose_fullstack_influxdb_v2.ymldocker-compose_fullstack_influxdb_v3.yml
Overview
The provided Docker Compose file sets up the following services:
- Butler SOS: The main application collecting metrics.
- InfluxDB: A time-series database to store the metrics.
- Grafana: A visualization tool to view the metrics.
Note
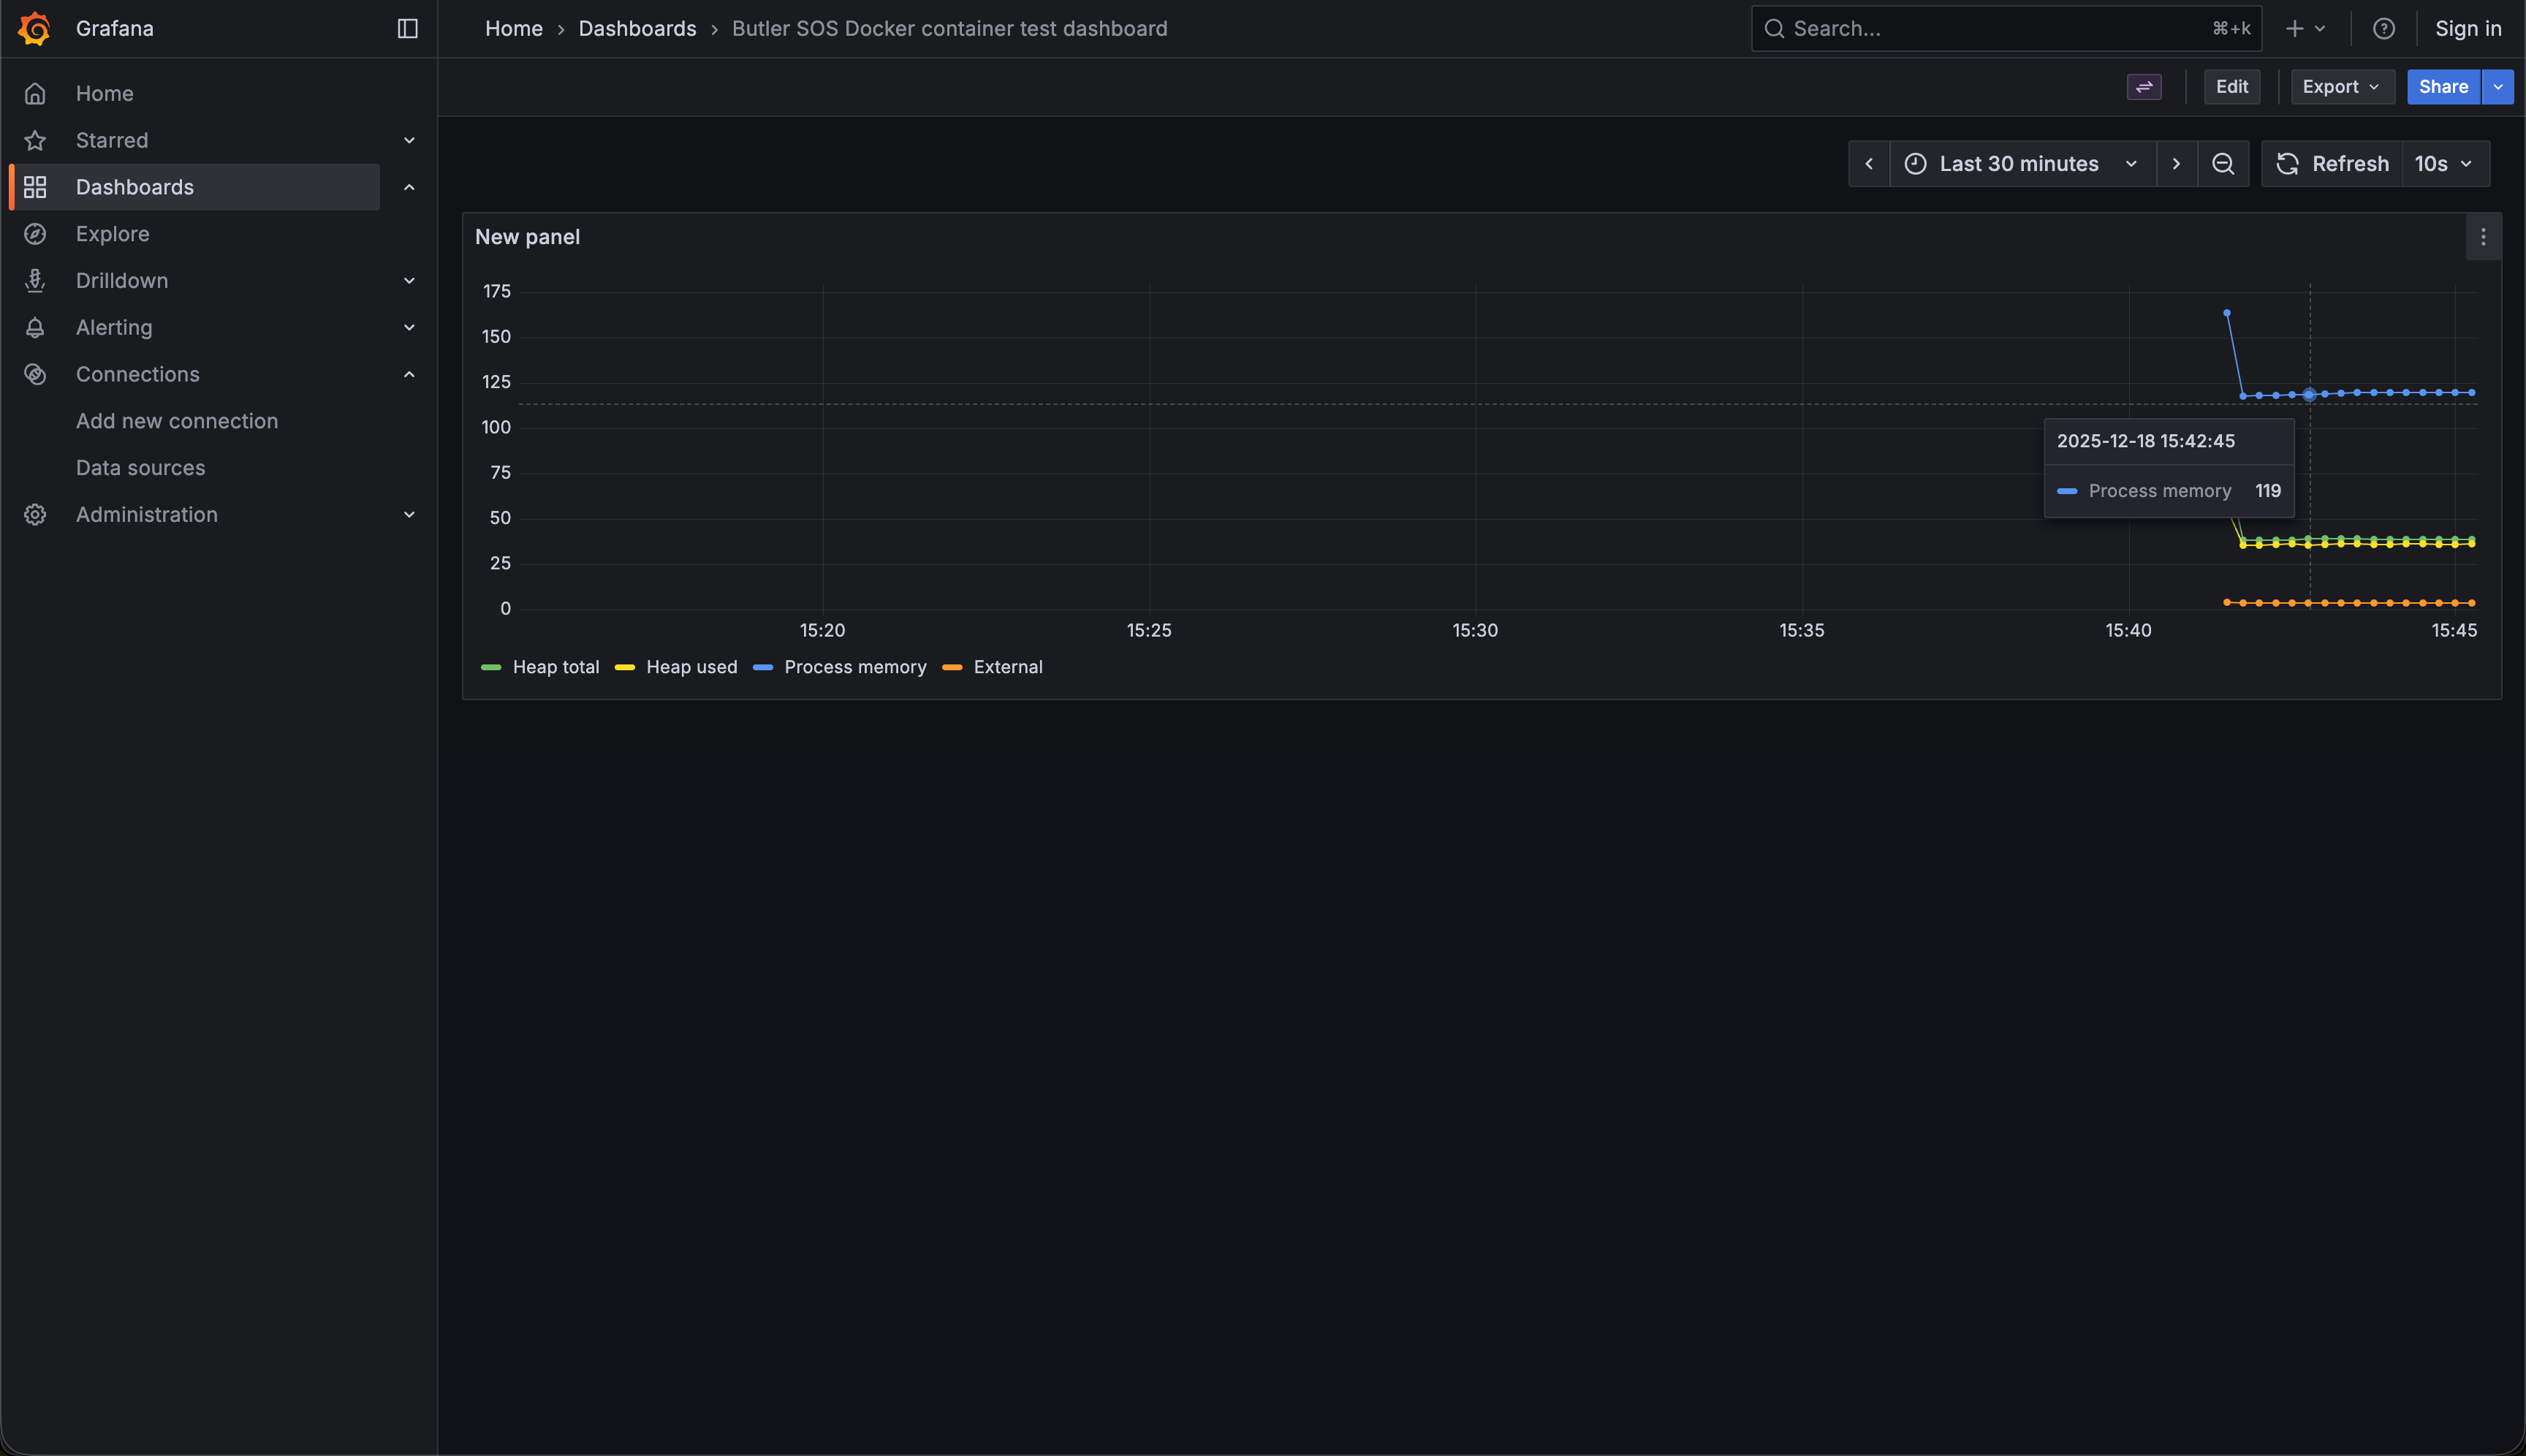
The data shown in this example is Butler SOS's own memory consumption. The configuration does not query any Qlik Sense servers.
Prerequisites
- Docker and Docker Compose installed on your machine.
Steps
Navigate to the
docs/docker-composedirectory in the Butler SOS repository.Run the following command to start the stack:
bashdocker-compose -f docker-compose_fullstack_influxdb_v1.yml up -dWait for the containers to start.
InfluxDB v3 Note
If you are using the InfluxDB v3 compose file (docker-compose_fullstack_influxdb_v3.yml), you will notice an additional service called setup-influxdb starting up.
This is a temporary helper container that automatically creates the database and configures the instance using a pre-defined token (mounted from config/admin_token.txt). This architecture ensures a fully automated startup experience without requiring manual token generation or CLI commands.
Security Note
Using a pre-defined token in a text file on disk is not recommended for production use. This approach is implemented here solely to provide an easy-to-use, automated example stack. In a production environment, you should use proper secret management and avoid storing sensitive tokens in plain text files.
Accessing Grafana
Once the stack is up and running, you can access Grafana in your web browser:
No login is required as anonymous access is enabled for this example.
Viewing the Dashboard
Grafana is pre-provisioned with a dashboard showing Butler SOS metrics.
- Open Grafana at http://localhost:3000.
- Navigate to Dashboards.
- Select the Butler SOS dashboard.
You should see a dashboard similar to the one below, displaying internal metrics from Butler SOS.